How Data Drives Adds Value to Basketball
There’s no question Noah Basketball’s shot-tracking, data-producing technology improves individual and team shooting statistics. With endorsements made by Tony Bennet, coach of the reigning NCAA Champion, the Virginia Men’s Basketball team, Anthony Tolliver, NBA Veteran and Admiral Schofield, rising NBA star for the Washington Wizards, the question isn’t if data drives value, it’s how data drives value — even beyond shooter performance.
Basketball is estimated to be the second most-watched sport worldwide. Upwards of 28 percent of the world population watches basketball — that’s 2.2 billion people. While Noah Basketball’s data is primarily used by players and coaches to improve shooting performance, what goes unnoticed is the ability of the same data to be used to impact how 2.2 billion people consume the sport.
It doesn’t take much to convince anyone that Steph Curry is the greatest three-point shooter of all time, but if someone needed proof, we could present them with data. Curry is heading into his 11th season in the NBA and has already caught Jason Terry in made three-pointers. Terry required 1,410 games to make 2,282 three’s to Curry’s mere 655 games.
Curry currently sits at 2,483 threes made — only 72 three-point baskets away from Reggie Miller (who finished his career with 2,555 in his 1,300th game) and 490 away from Ray Allen (who finished his 18-season career with 2,973 three’s). Assuming Curry stays healthy and on pace with averaging 3.57 three-pointers per game, he will catch up to Allen in 138 games.
For basketball coaches, having access to data gives them the ability to figure out from where, how often and how well players shoot on the court.
For the 2.2 billion basketball fans, simply having access to hundreds of players’ data hardly sounds useful, until they realize the detailed analyses they could receive while watching a broadcasted game or simply scrolling on their social media feed.
When a player takes a deep shot, misses and you say, “Ugh, that was a bad shot!” — data may show the attempt was actually a fair one, taking into account all of the player’s previous attempts and makes. While the player may not have made the shot, it was still a good attempt because this player historically shoots above average from that spot and distance on the court.
A player who normally sinks three’s with ease has gone one for five behind the arc in the first half. Basketball fans are wondering why he’s having an off game. Data could tell you — maybe the defense is forcing him to take shots from his weak side of the court, or perhaps the defense is engaging faster causing him to rush his shooting motion and alter his release angle.
It might be widespread knowledge that these days the most common shots taken in basketball come from just behind the arc (about tweety-three feet from the basket) or right under the basket (less than five feet). However, without the data and detailed analyses, the average basketball fan wouldn’t know these shots are taken more frequently because they have a greater value of points per shot based on their risk and payoff. Conventional wisdom of knowing that as you get closer to the hoop the probability of making the shot rises, may lead to the assumption that with each foot closer the attempt increases in potential value. Data argues differently. Using 2018-2019 NBA League data and the weighted average value of potential outcomes, we see that while every shot taken from inside the arc is only worth two points, the likelihood of making those shots within five feet is much higher, therefore giving those attempts a greater value. We then see that attempts taken behind the arc actually have the next highest value, largely based on the 150% bonus for successful attempts. This leaves mid-range shots as actually the least valuable because the probability of success is lower than attempts from under the basket but still carries the lower payoff. This analysis likely accounts for the growing popularity of the 3-point line and the evidence that 3-point shots are being practiced more than ever, leading to more shots falling during games. However, the data does reveal that conventional wisdom kicks back in after about twenty-five feet and the value of points per field goal attempt begins to diminish the further behind the arc players shoot.

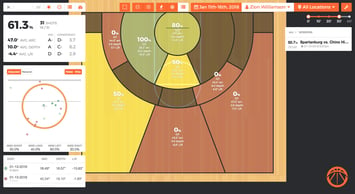
From looking at Noahlytics data maps, a person can infer a lot about a player’s chart. The performance in the chart pictured probably came from a left-handed post player. Most of his shots were taken below the basket and almost none were taken from the right side of the court. The NBA league average for made shots within 5 feet from the basket is only 59.9%, while this high school player shot 80% from the same area in the 2018 Spalding Hoophall Classic.
As technology like Noah’s continues to collect data during practices and games, more analysts will be able to develop digestible content, provide shooting knowledge to all basketball fans and aid Fantasy Basketball players, sports gamblers, and beginners itching to become experts on the game of basketball and the elements of shooting.